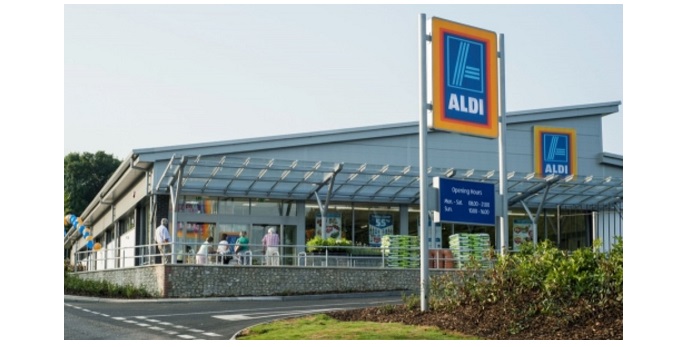
The latest grocery market share figures from Kantar Worldpanel for the 12 weeks to 4 November 2018, show shoppers have made an additional 14 million trips to Aldi and Lidl compared with last year.
Fraser McKevitt, head of retail and consumer insight at Kantar Worldpanel, said: “Five years ago, just under half of British households were visiting one of the discount retailers at least once in a 12 week period. This now stands at almost two-thirds, which is reflected in their continued growth.
“Aldi’s sales increase of 15.5% this period is the fastest rate since January 2018; this has helped lift its market share by 0.9 percentage points to 7.6%, which is the largest year-on-year share gain by any retailer in nearly four years. Meanwhile, Lidl is in double digit growth for the second month running; sales are up by 10.2% compared with a year ago and its market share is up 0.4 percentage points to 5.5%.”
At a total market level, sales increased by 2.6%. This is slower compared with recent months but still represents a £663 million increase in sales through the tills. Much of the growth came through smaller top up trips, which increased at twice the rate of larger trolley shops.
Among the retailers Co-op was the other big winner this period, with sales up by 5.1%. The retailer has cornered a further 0.2% of the market, taking its total share to 6.3% and securing a seventh consecutive period of sales growth. The grocer has attracted an extra 213,000 shoppers in the latest period while own label has had an especially noteworthy performance, outpacing brands particularly in categories as varied as biscuits, ice cream and cleaning supplies.
A high-profile environmental stance is helping Iceland to thrive among a much wider set of shoppers than its traditional heartland, as Fraser McKevitt explains: “Nearly 37% of Iceland’s sales come from the more affluent ABC1 social group – five years ago this was less than a third. Its banned palm oil Christmas advert is tugging at the heartstrings of Britain’s middle classes and could translate into strong sales growth, especially if it manages to pique the interest of the half of the population who haven’t shopped there in the past year. Sales are already up by 5.0% this period and while frozen food is still increasing, 94% of this growth actually comes from its fresh, chilled and ambient food aisles.”
Sales at Asda have increased by 2.6% year-on-year meaning the retailer has now been in continual growth since April 2017. A strong online performance was bolstered by increased spend in-store and, despite being a more brand-orientated retailer, sales of both the core Asda lines and its premium Extra Special range grew faster than branded products.
Morrisons has achieved its 25th consecutive period of growth, with sales up 1.5% in the 12 weeks to 4 November. McKevitt said: “In line with its competitors Morrisons is making fewer sales overall through promotions though it has been steadily increasing the number of products sold through multi-buy deals since May. The retailer’s market share has fallen slightly, down 0.1 percentage points to 10.3%.”
At Tesco sales were up by 0.4%, with market share down by 0.6 percentage points to 27.5%; Sainsbury’s sales fell by 0.6%, the first decline for the retailer since June. However, its e-commerce channel continues to be a bright spot and is achieving double digit growth as it reaches 7% of Sainsbury’s total shopper base.
Sales fell by 1.0% at Waitrose, marking the first decline for the John Lewis-owned supermarket since February 2009 – shortly before it launched its Waitrose Essentials range. This brings an end to the longest run of growth for any of the bricks and mortar retailers excluding the discounters – in these 126 periods Waitrose’s share of the market rose from 3.9% to 5.1% today. Online specialist Ocado saw sales rise by 4.3%, with share remaining at 1.1%.
| Total Till Roll – Consumer Spend | 12 w/e 5 Nov 2017 |
Share | 12 w/e 4 Nov 2018 |
Share | Change | ||
|---|---|---|---|---|---|---|---|
| £M | %* | £M | %* | % | |||
| Total Grocers | 25,978 | 100.0 | 26,641 | 100.0 | 2.6% | ||
| Total Multiples | 25,506 | 98.2 | 26,203 | 98.4 | 2.7% | ||
| Tesco | 7,293 | 28.1 | 7,323 | 27.5 | 0.4% | ||
| Sainsbury’s | 4,222 | 16.3 | 4,198 | 15.8 | -0.6% | ||
| Asda | 3,973 | 15.3 | 4,075 | 15.3 | 2.6% | ||
| Morrisons | 2,707 | 10.4 | 2,748 | 10.3 | 1.5% | ||
| Aldi | 1,752 | 6.7 | 2,023 | 7.6 | 15.5% | ||
| Co-op | 1,588 | 6.1 | 1,668 | 6.3 | 5.1% | ||
| Lidl | 1,335 | 5.1 | 1,470 | 5.5 | 10.2% | ||
| Waitrose | 1,372 | 5.3 | 1,357 | 5.1 | -1.0% | ||
| Iceland | 531 | 2.0 | 557 | 2.1 | 5.0% | ||
| Ocado | 287 | 1.1 | 299 | 1.1 | 4.3% | ||
| Other Multiples | 447 | 1.7 | 484 | 1.8 | 8.1% | ||
| Symbols & Independents | 472 | 1.8 | 438 | 1.6 | -7.3% |


