Farmers in Northern Ireland have experienced a staggering rise in income in the past year, according to new estimates published by the Department of Agriculture, Environment and Rural Affairs (DAERA).
Provisional figures indicate that the ‘Total Income from Farming’ (TIFF) in Northern Ireland rose by 87% (82% in real terms) from £253million in 2016 to £473million in 2017.
TIFF represents the return on own labour, management input and own capital invested for all those with an entrepreneurial involvement in farming. It represents farm income measured at the sector level.
Total Gross Output for agriculture in Northern Ireland was 17% higher at £2.09billion in 2017. There was a 21% increase in the value of output from the livestock sector, while field crops rose by 14% and horticulture was 4% higher. These figures are for the calendar year and therefore they represent the outturn across two harvest years.
Dairying remains the largest contributor to the total value of Gross Output at £662million in 2017; a rise of 46%. The annual average farm-gate milk price rose by 42% in 2017 to 28.7 pence per litre while the volume of raw milk produced in Northern Ireland increased by 4% to 2.3 billion litres.
The output value of cattle was 6% higher at £460million in 2017. The total number of animals slaughtered increased by 1% in 2017, but with average carcase weights for both clean and cull animals falling by 2%, the volume of meat produced was marginally lower. The average producer price for finished clean cattle was £3.48 per kilogram in 2017 while the average producer price for cull animals was £2.47 per kilogram. These average prices were 9% and 14% higher than the respective averages for 2016.
The value of output from sheep decreased by 2% to £73million in 2017. The market value of the sector increased by 4% for the year but this was offset by a significant stock change movement. The increase in market value was a combination of a 2% increase in the producer price (to £3.97 per kg) and a 1% increase in the total number of sheep slaughtered. The total volume of sheep-meat produced was 1% higher than 2016. The average carcase weight was 22 kilograms.
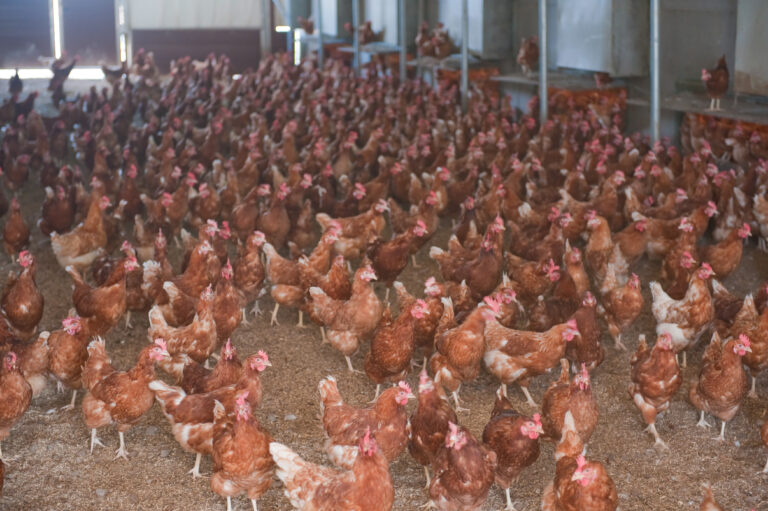
There were increases in the values of output for all three intensive livestock sectors during 2017, with the pig sector increasing by 35% to £163million, the egg sector by 5% to £100 million, while the value of poultry output increased by 9% to £275million. All three sectors recorded an increase in production volumes, with eggs and poultry (both) up by 9% while pigs were marginally higher compared with the previous year. The producer prices in the poultry and pig sectors rose by 4% and 29%, respectively, whereas the producer price for eggs reduced by 3%.
The total output value for field crops increased by 14% in 2017 to £66million. This was as a result of increases in the price for barley, wheat and oats. Values across a calendar year reflect two harvests. The value of output of potatoes in 2017 also rose, to £24million. This was a result of an increase in potato production due to an increase in the area grown in 2017, while the producer price remained static. The value of output for wheat increased by 31% to £11million and the output value of barley rose by 6% to £18million.
The value of output recorded in the horticulture sector was also higher in 2017, at £108million. This was driven in part by volume increases in the fruit and flowers sectors. The mushroom sector is the largest of these sectors by value, with an estimated output value of £53million.
The estimated value of 2017 direct subsidies (Basic, Greening and Young Farmer payments) was £287million, representing an increase of 5%, when compared with the 2016 payments. This was due to the more favourable exchange rate between Sterling and the Euro.
The total value of Gross Inputs increased by 8% in 2017, to £1.45billion. Feedstuff costs, which accounted for 54% of the total Gross Input estimate, rose by 11% to £783million in 2017. There was a 9% increase in the volume of feedstuffs purchased and a 2% increase in the average price paid per tonne.
The total cost of fertiliser purchases in 2017 rose by 20% as a result of a 16% rise in the volume purchased and a 3% increase in the average price paid per tonne. There was a 6% reduction in total lime purchases, with the result that total expenditure on fertilisers and lime was £84million.
Total machinery expenses increased by 4% to £143million in 2017, as a result of an 8% increase in the cost of fuel and oils. This is in line with the global commodity price during the year.
A detailed document covering the period 2011–2017 and containing all the key figures used to derive TIFF in Northern Ireland can be downloaded from the DAERA website.
Estimates for the United Kingdom will not be released until April 2018 and a breakdown of TIFF for the UK will not be available until then.
The Ulster Farmers’ Union cautioned against making assumptions about farmers’ circumstances. “Farmers continue to face tough times across many enterprises,” said UFU president Barclay Bell. “This increase was due to a combination of increased output and a more favourable sterling/euro exchange rate. This increased CAP payments by five per cent and the figures underline the continued importance of this direct financial support. This made up over 60% of farm incomes. It must also be remembered that input costs were up by 8% and are continuing to rise.”


